Australian Broadband Data Demand: NBN Co keeps Aussies connected as demand remains high
- Australian Broadband Data Demand report highlights on the main nbn wholesale service:
- Weekly download throughput peak of 12.6 Terabits per second (Tbps) recorded on Saturday, 9 May during the Evening Busy Hours
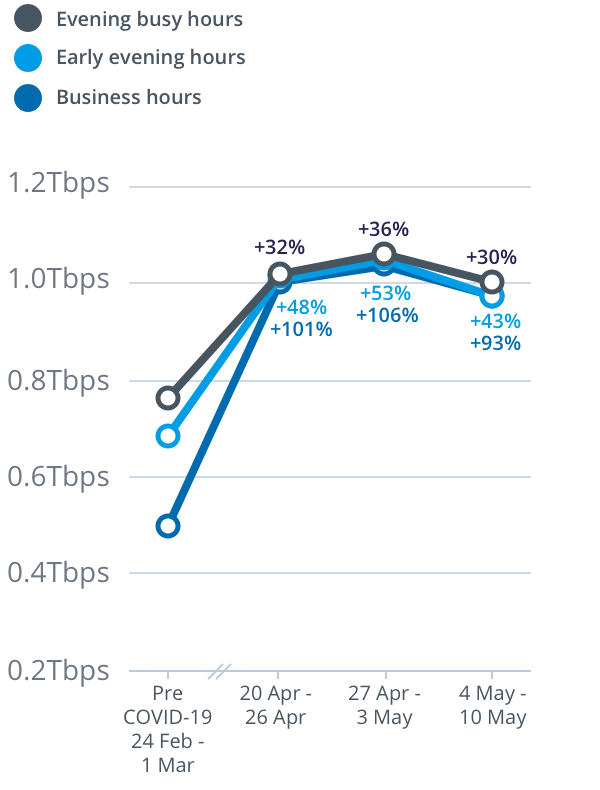
- Weekly upload throughput peak of 1.00Tbps recorded on Tuesday, 5 May during the Evening Busy Hours
- New SMS messages introduced to ensure customers and technicians can stay safe
NBN Co continues to record high demand for both data and new service connections as Australians continue to rely heavily on the nbn for their work, study, telehealth, online shopping, social and entertainment needs.
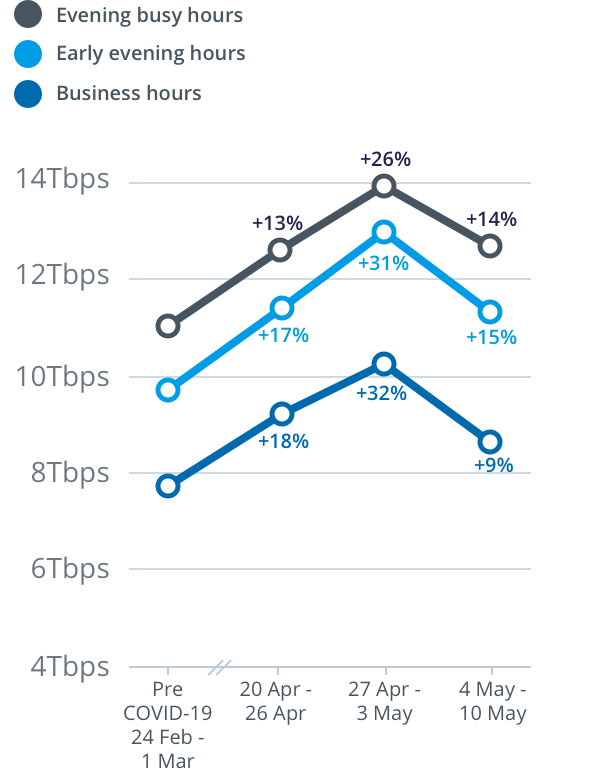
The latest figures from the Australian Broadband Data Demand report reveal that data demand on the nbn’s main wholesale access service remains well above the pre-COVID-19 baseline. The weekly report shows the highest throughput recorded in a week during daytime business hours, early evening hours and busy evening hours.
For the week from Monday 4 May to Sunday 10 May, peak download throughput (the measure of data flowing through the nbn™ access network) during the busy evening period increased by 14 per cent to 12.6 terabits per second (Tbps) on the main nbn wholesale service, compared to the last week of February (which nbn measures as its normal pre-COVID-19 baseline). However, demand has subsided nine per cent from the record peak download throughput of the previous week.
Brad Whitcomb, Chief Customer Officer at NBN Co said: “Although some social distancing measures are beginning to ease in some states and territories, Australian households are still depending on the network for work, school and to socialise with family and friends. More than 7 million homes and businesses are now connected to the nbn, and we continue to add thousands more every week. Despite these challenging times, our field technicians and delivery partners across Australia continue to roll out the network, connect premises and quickly repair any faults that may arise, and we are pleased to report that faults across the network are at an all-time low.”
To help manage demand in the unique circumstances presented by COVID-19 social distancing, NBN Co has introduced new measures to ensure customers and technicians can stay safe. NBN Co and its delivery partners have started sending SMS messages to customers prior to all appointments, to confirm the wellbeing of customers before connecting homes and businesses to the nbn or undertaking service repairs. This helps prevent contact between field technicians and residential or business customers who may be in self-quarantine or unwell.
“The NBN Co team has been working tirelessly to help keep Australians connected when they need it most. This simple use of technology is a great way to provide peace of mind to customers and help to protect our field technicians from unwittingly attending premises where someone is in quarantine, unwell, or where the resident would simply prefer to defer their appointment,” Mr Whitcomb said.
For the week beginning Monday 4 May, peak download throughput compared to the pre-COVID-19 baseline also increased during daytime business hours, up 9 per cent to 8.5Tbps, and during early evening hours, up 15 per cent to 11.3Tbps, on the main nbn wholesale service.
Downstream network usage
Upstream network usage
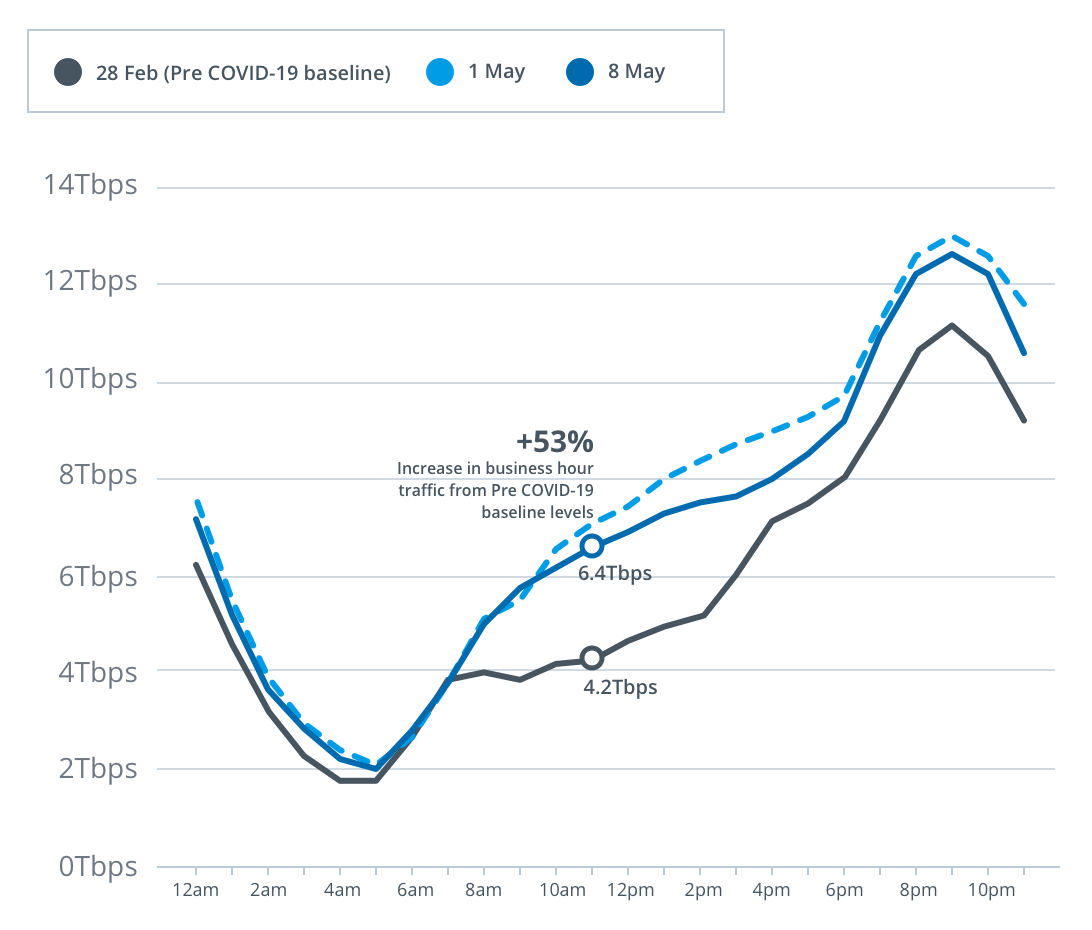
Downstream network usage over 24 hours
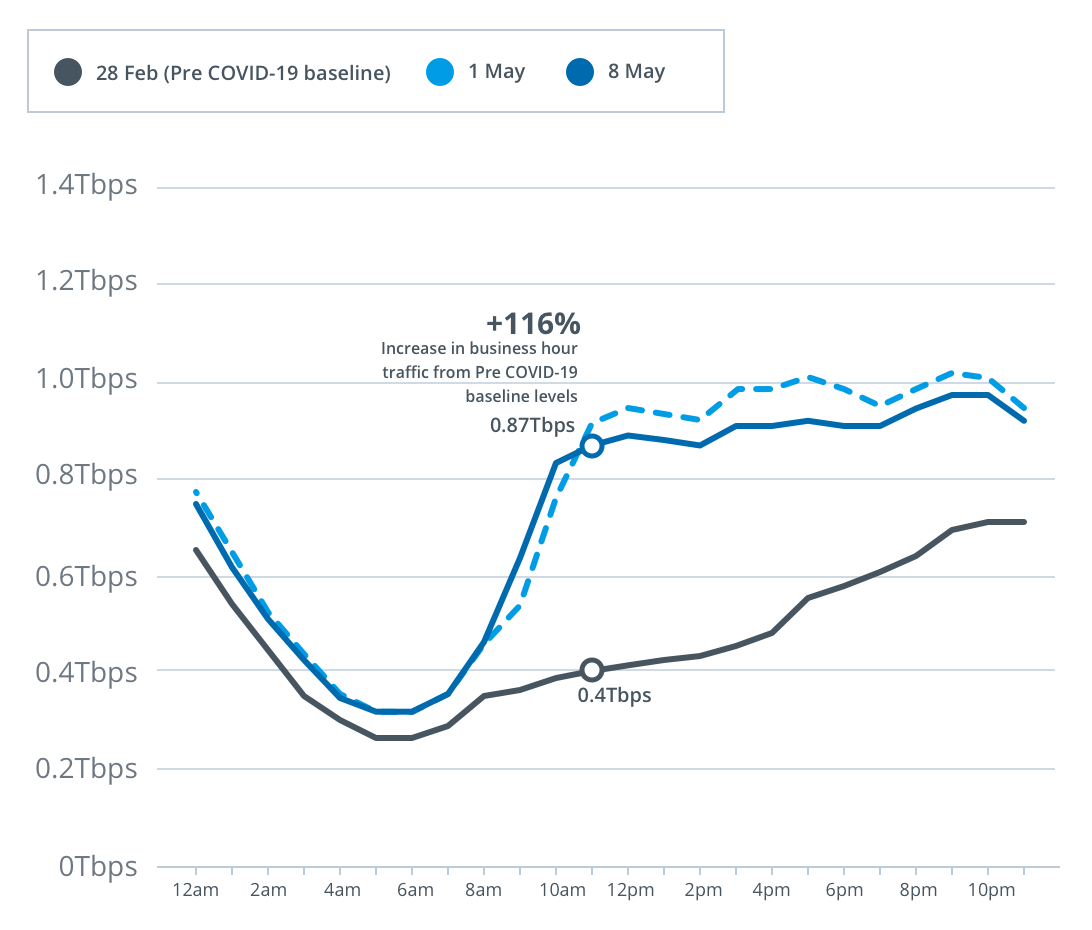
Upstream network usage over 24 hours
The Australian Broadband Data Demand report is updated weekly on nbn’s Transparency dashboard at: www.nbn.com.au/updates
For tips on how to make the most of your nbn connection and to learn more on what NBN Co is doing to support Australia through COVID-19, please visit: www.nbnco.com.au/campaigns/covid-19
Notes to editor:
- These metrics represent the upstream/downstream throughput peak each week, across the following three distinct periods:
o Business hours - Monday to Friday 8am to 4:59pm
o Early evening hours - Monday to Sunday 5pm to 7:59pm
o Evening busy hours - Monday to Sunday 8pm to 11:59pm
- For Business Hours, the peak is determined by taking the highest downstream throughput for our TC-4 service from the busiest 15-minute increment for downstream throughput, and from the busiest 30-minute increment for upstream, between Monday to Friday. The Early Evening Hours and Busy Evening Hours figures are recorded using the same methodology, but over a seven day period.
- TC-4 is nbn’s standard wholesale broadband service that is designed primarily for general internet and standard data services across all access technologies.
- NBN Co considers the throughput peak metric for our TC-4 service as the most appropriate measure for growth in data flowing through the network as it shows when network use is at its highest in each defined period in a week for our wholesale access service most used for residential broadband services.
- This graph shows TC-4 usage (measured in terabits per second for both upstream and downstream) over a 24 hour period (using Australian Eastern Standard/Daylight time on the dates shown in the key). It compares the results from those two dates against a corresponding 24 hour period from nbn’s pre-COVID-19 baseline on 28 February 2020 (the last week of February). Each marker on the x axis represents an hour period in the day. The y axis shows, for each of the 60 minute periods in that 24 hour period:
o The downstream throughput measure calculated by recording the highest downstream throughput for our TC-4 service from the busiest 15 minute increment in that 60 minute period.
o The upstream throughput measure calculated by recording the highest upstream throughput for our TC-4 service from the busiest 30 minute increment in that 60 minute period.
- The terabits per second (Tbps) value is rounded to one decimal place. The percentage increase is rounded to the nearest whole number.
Media enquiries
Naomi Beames
Phone: 0414 621 767