Australian Broadband Data Demand: data demand remains above pre-COVID-19 baseline
- Australian Broadband Data Demand report highlights on the main nbn wholesale service:
- Weekly download throughput peak of 14.6 Terabits per second (Tbps) recorded on Saturday, 11 July during the evening busy hours
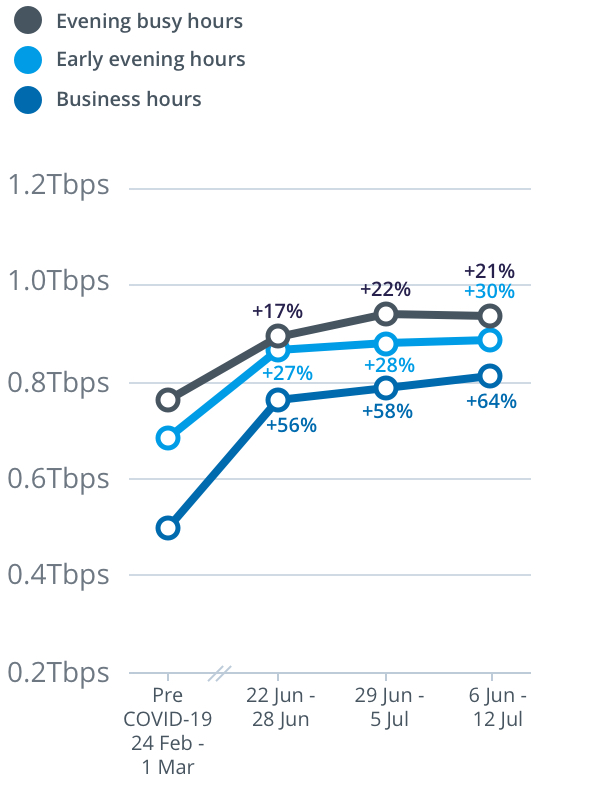
- Weekly upload throughput peak of 0.93 Tbps recorded on Sunday, 12 July during the evening busy hours
An all-time peak in download data demand was recorded on nbn’s main wholesale access service on Saturday, 11 July, according to new figures from the Australian Broadband Data Demand report.
The record in peak download data demand reflects increased household internet activity as more people stayed home as a result of COVID-19 social distancing requirements, particularly in Victoria, as well as organic internet activity growth with the addition of new customers to the nbn™ network since the beginning of the pandemic. Data demand during the week was also influenced by changes made by some major streaming video services to their video codecs.
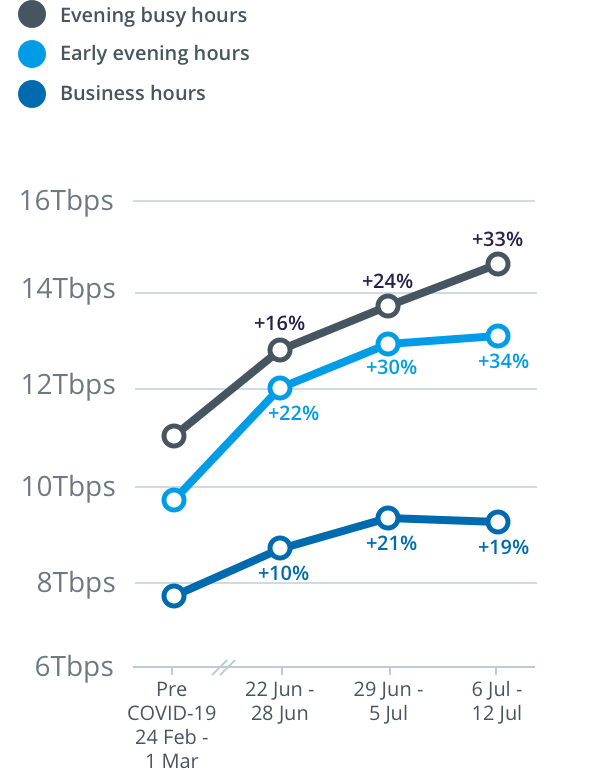
For the week from Monday, 6 July to Sunday, 12 July, peak download throughput (the measure of data flowing through the nbn™ network) during the busy evening period increased by 33 per cent to 14.6 Terabits per second (Tbps) on the main nbn wholesale service, compared to the last week of February (which nbn measures as its normal pre-COVID-19 baseline).
Peak download throughput during the same week also increased during daytime business hours, up 19 per cent to 9.3Tbps, and early evening hours up 34 per cent to 13.2Tbps, compared to the pre-COVID-19 baseline.
Australian Broadband Data Demand is a weekly report into the peak throughput recorded in a week during daytime business hours, early evening hours and busy evening hours.
“We’ve seen data demand grow on the network every year as more customers connect and as they have increased their use of data-intensive services like streaming video. More than 600,000 new customers have joined the nbn™ since February 2020, with the network now helping to support the data requirements of a total of almost 7.5 million customers,” said Brad Whitcomb, Chief Customer Officer at NBN Co.
“Downstream network usage generally peaks in the busy evening period when more people are accessing video streaming and other entertainment services, and demand is higher than during the business hours. We are continuing to monitor data demand to help ensure that the network meets the needs of the nation,” Mr Whitcomb said.
Downstream network usage
Upstream network usage
Downstream network usage over 24 hours
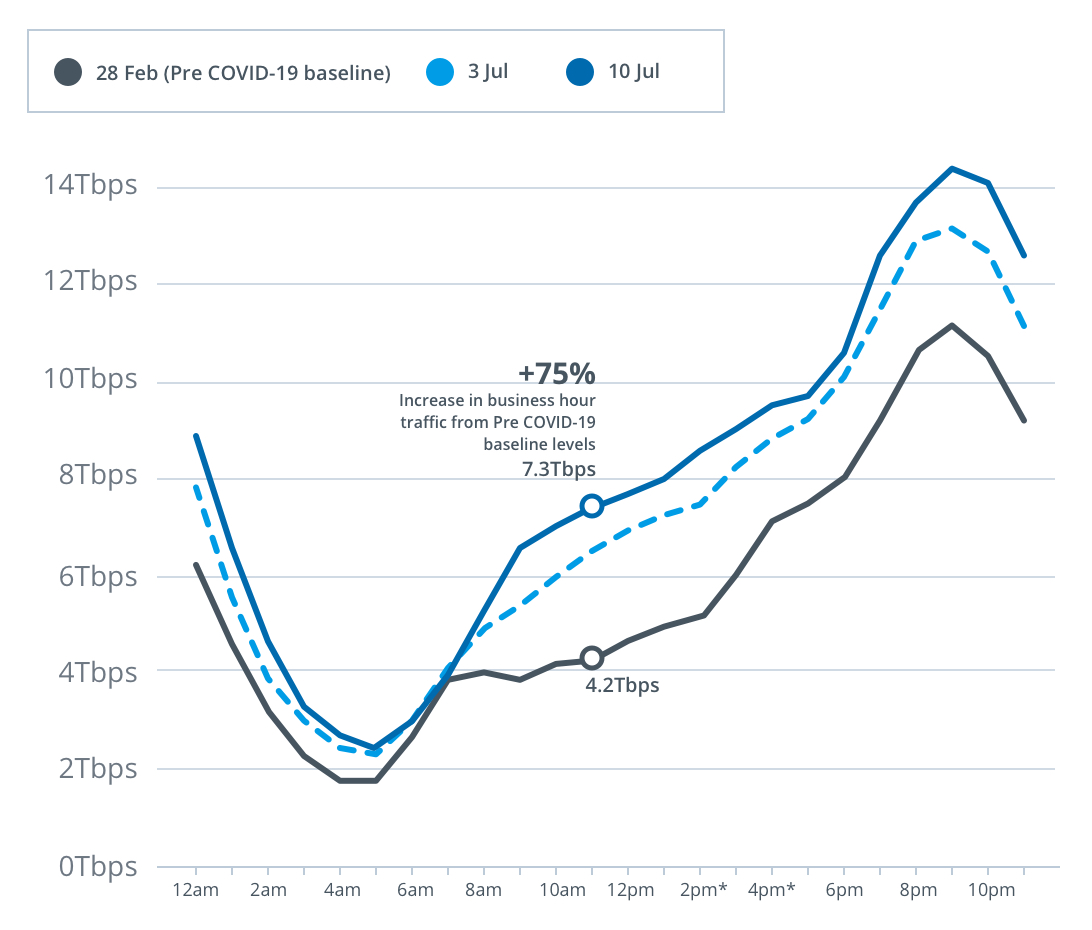
* The “Downstream network usage” graph in the week of 6 July - 12 July has been calculated using an estimate for the 2pm, 3pm and 4pm readings for Friday 10 July. This is due to a network incident which meant that actual network traffic usage was not captured during that time at a particular Serving Area Module. nbn has generated the estimates using the hourly growth rates from Friday 3 July at 2pm, 3pm and 4pm, and applied those growth rates to the 1pm readings for Friday 10 July. Please treat these graphs with caution when using them for comparison purposes.
Upstream network usage on the nbn™ main wholesale service during business hours on 10 July 2020 was 77 per cent higher (as shown in the graph below at 11am) than the pre-COVID-19 baseline.
Upstream network usage over 24 hours
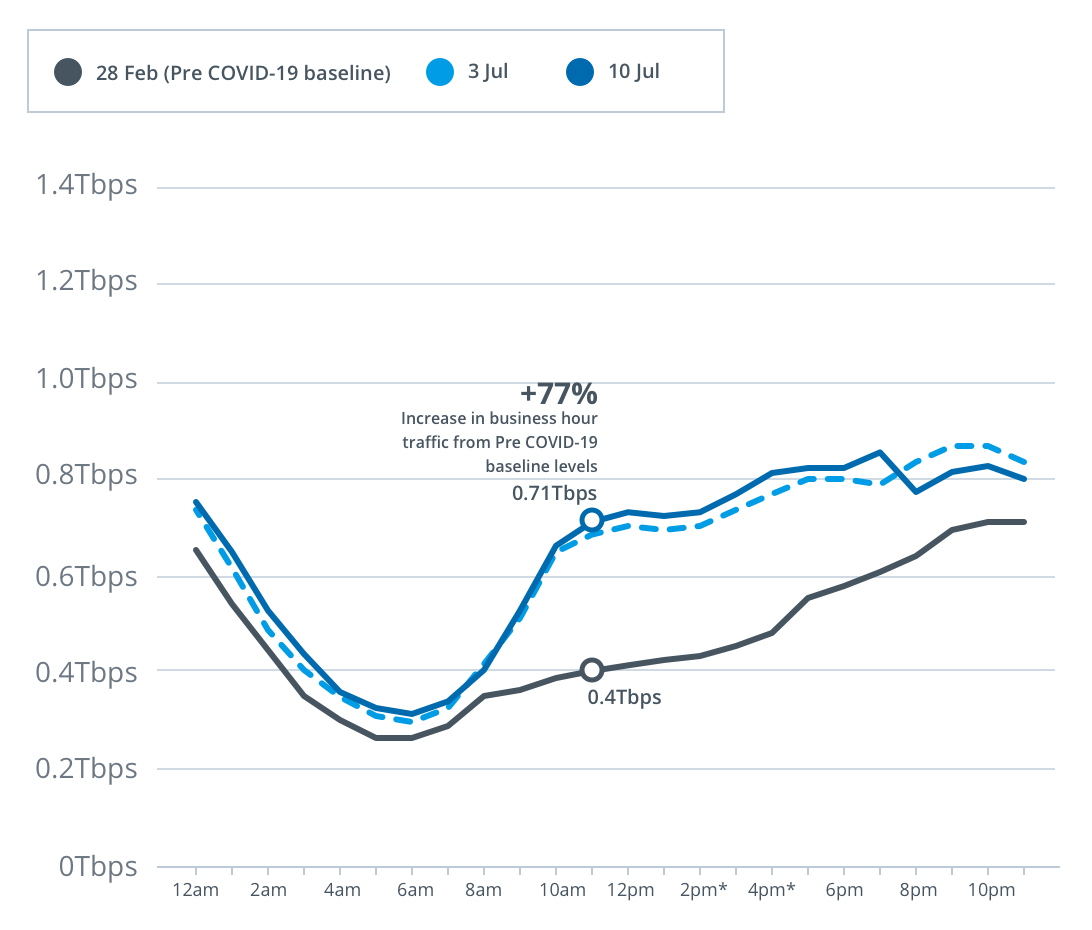
* The “Upstream network usage” graph in the week of 6 July - 12 July has been calculated using an estimate for the 2pm, 3pm and 4pm readings for Friday 10 July. This is due to a network incident which meant that actual network traffic usage was not captured during that time at a particular Serving Area Module. nbn has generated the estimates using the hourly growth rates from Friday 3 July at 2pm, 3pm and 4pm, and applied those growth rates to the 1pm readings for Friday 10 July. Please treat these graphs with caution when using them for comparison purposes.
The Australian Broadband Data Demand report is updated weekly on nbn’s Transparency dashboard at: www.nbn.com.au/updates
For tips on how to make the most of your nbn connection and to learn more on what NBN Co is doing to support Australia through COVID-19, please visit: www.nbnco.com.au/campaigns/covid-19
Notes to editor:
- These metrics represent the upstream/downstream throughput peak each week, across the following three distinct periods:
o Business hours - Monday to Friday 8am to 4:59pm
o Early evening hours - Monday to Sunday 5pm to 7:59pm
o Evening busy hours - Monday to Sunday 8pm to 11:59pm
- For Business Hours, the peak is determined by taking the highest downstream throughput for our TC-4 service from the busiest 15-minute increment for downstream throughput, and from the busiest 30-minute increment for upstream, between Monday to Friday. The Early Evening Hours and Busy Evening Hours figures are recorded using the same methodology, but over a seven day period.
- TC-4 is nbn’s standard wholesale broadband service that is designed primarily for general internet and standard data services across all access technologies.
- NBN Co considers the throughput peak metric for our TC-4 service as the most appropriate measure for growth in data flowing through the network as it shows when network use is at its highest in each defined period in a week for our wholesale access service most used for residential broadband services.
- This graph shows TC-4 usage (measured in terabits per second for both upstream and downstream) over a 24 hour period (using Australian Eastern Standard/Daylight time on the dates shown in the key). It compares the results from those two dates against a corresponding 24 hour period from nbn’s pre-COVID-19 baseline on 28 February 2020 (the last week of February). Each marker on the x axis represents an hour period in the day. The y axis shows, for each of the 60 minute periods in that 24 hour period:
o The downstream throughput measure calculated by recording the highest downstream throughput for our TC-4 service from the busiest 15 minute increment in that 60 minute period.
o The upstream throughput measure calculated by recording the highest upstream throughput for our TC-4 service from the busiest 30 minute increment in that 60 minute period.
- The terabits per second (Tbps) value is rounded to one decimal place. The percentage increase is rounded to the nearest whole number.
Media enquiries
Naomi Beames
Email: naomibeames@nbnco.com.au
Phone: 0414 621 767
NBN Co Media Hotline
Email: media@nbnco.com.au
Phone: 0414 621 767